
Advertisement - Click on the banner below to visit our sponsor
We can modify your web-site to be able to tell you from which geographic region visitors are coming from to look at your web-site,
how long and on which pages(s) they stay, from which web-site or search engine they come from, where they are going next, which medium (PC, MAC, tablet, smart-phone, ...)
they are using. This is essential for you to optimize your web-site for different layouts (PC, tablet, smart phone), different languages, different keywords, put ads
on various web-sites or search engines, etc. This is a great Marketing tool.
Web Analytics provides a huge number of reports and statistics. We show here only a very small example of the available reports (literally hundreds).
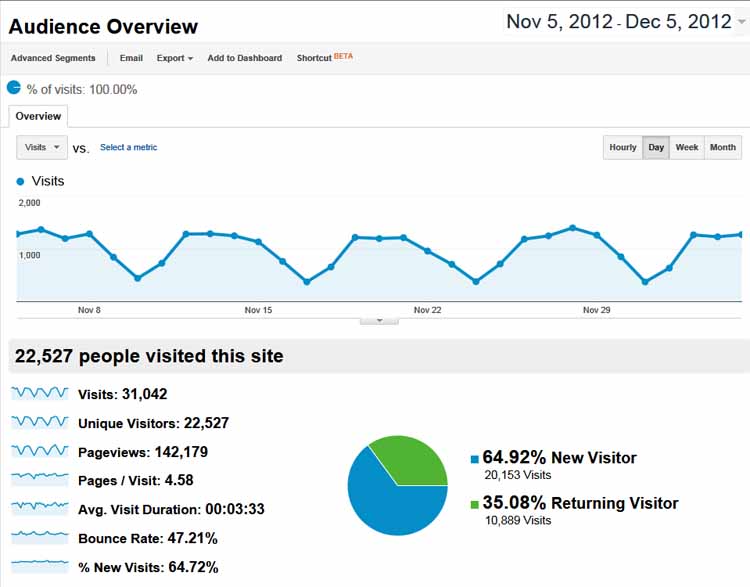
This example of a Web Analytics report shows 31,042 visitors in the observation period, 22,527 were unique visitors.
These visitors looked at 142,179 web-pages (approx. 4.58 per visit) - Obviously, they found some interesting stuff to look at.
On average they stayed for 3 minutes and 33 seconds. This could be a bit longer, but it also could be OK - we will have to check the context and further data.
The bounce rate was 47.21% - this means that 47.21% left the web-site after looking at the very first page. We will have to check that number
(were the visitors expecting something else?, was the landing page not interesting enough?,
we will have to look at the bounce rate per landing page to see if there is a trend there, but also review the key words),
but it makes the previous number (duration) look better.
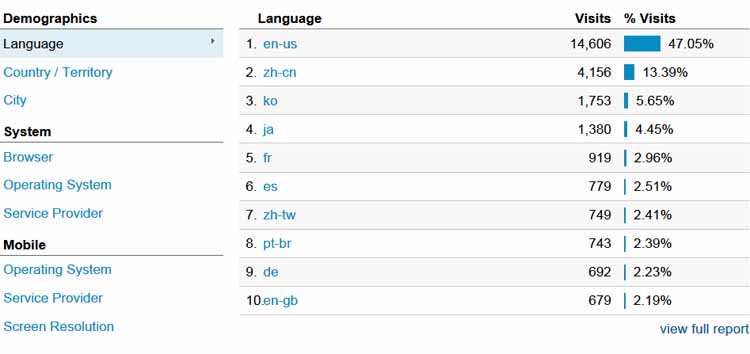
47% of all visitors came from the USA, 13% from Mainland China, 5.5% from South Korea and 4.5% from Japan.
Translating (part of) the web-site into Mandarin could be considered. If the target market is Japan and Korea though,
then we should focus on those countries with localized pages and local ads.
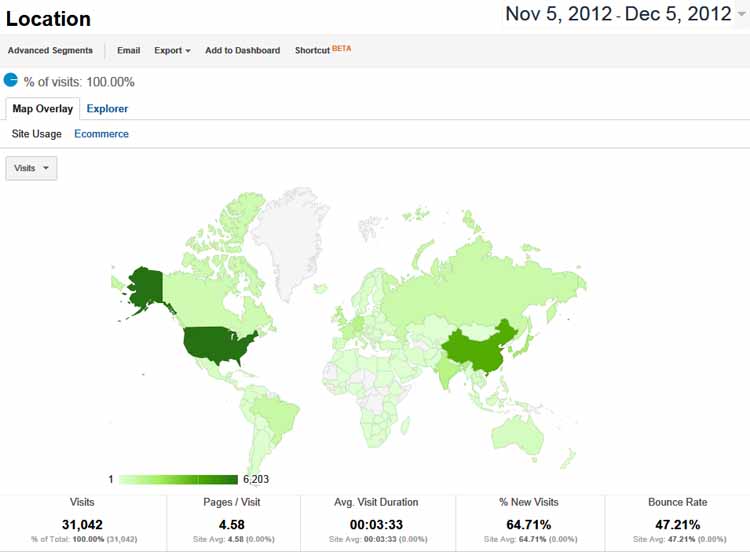
This display show the visits by country. It makes it easy to ask the following questions:
Do I get the visits from the countries I am targeting? Id not, what action should we take (advertising, translation, SEO, etc...).
I do see more than average visits from countries like the USA, and China, but also Brazil, Canada, Mexico, Britain, France, Spain, Russia, Australia and India.
Do I have these countries covered?
By clicking on the country in the report, I can see more detailed statistics for smaller geographic areas, down
to the city level.
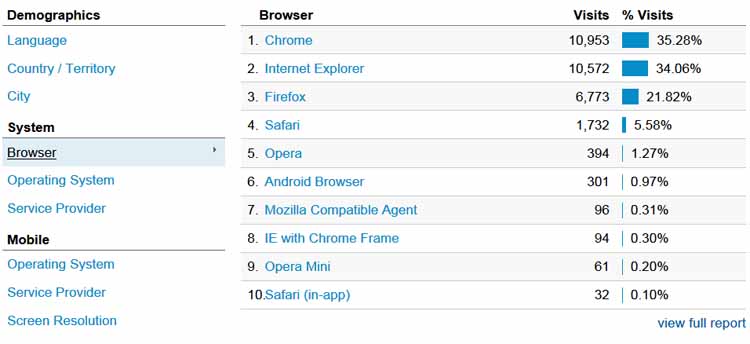
Here we see the browsers used to visit our web-site.
Chrome, IE and Firefox being the leaders.
Does our web-site support especially these, but also the rest of the browsers fully? Are we using feature which are not supported by some of the browsers?
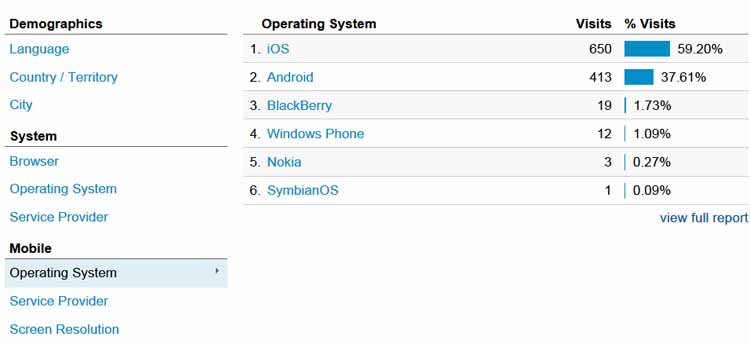
This report shows the operating system for mobile devices,
iOS being the leader. Is the layout of our web-pages ready for mobile devices like the iPad, the iPhone and Android devices?
Be careful not to jump to conclusions about general trends - the visitors to this web-site are very high-tech people, the high use of
tables and smart-phones is not surprising. It is good to know the audience, but great to see in statistics what visitors use when accessing our web-site.